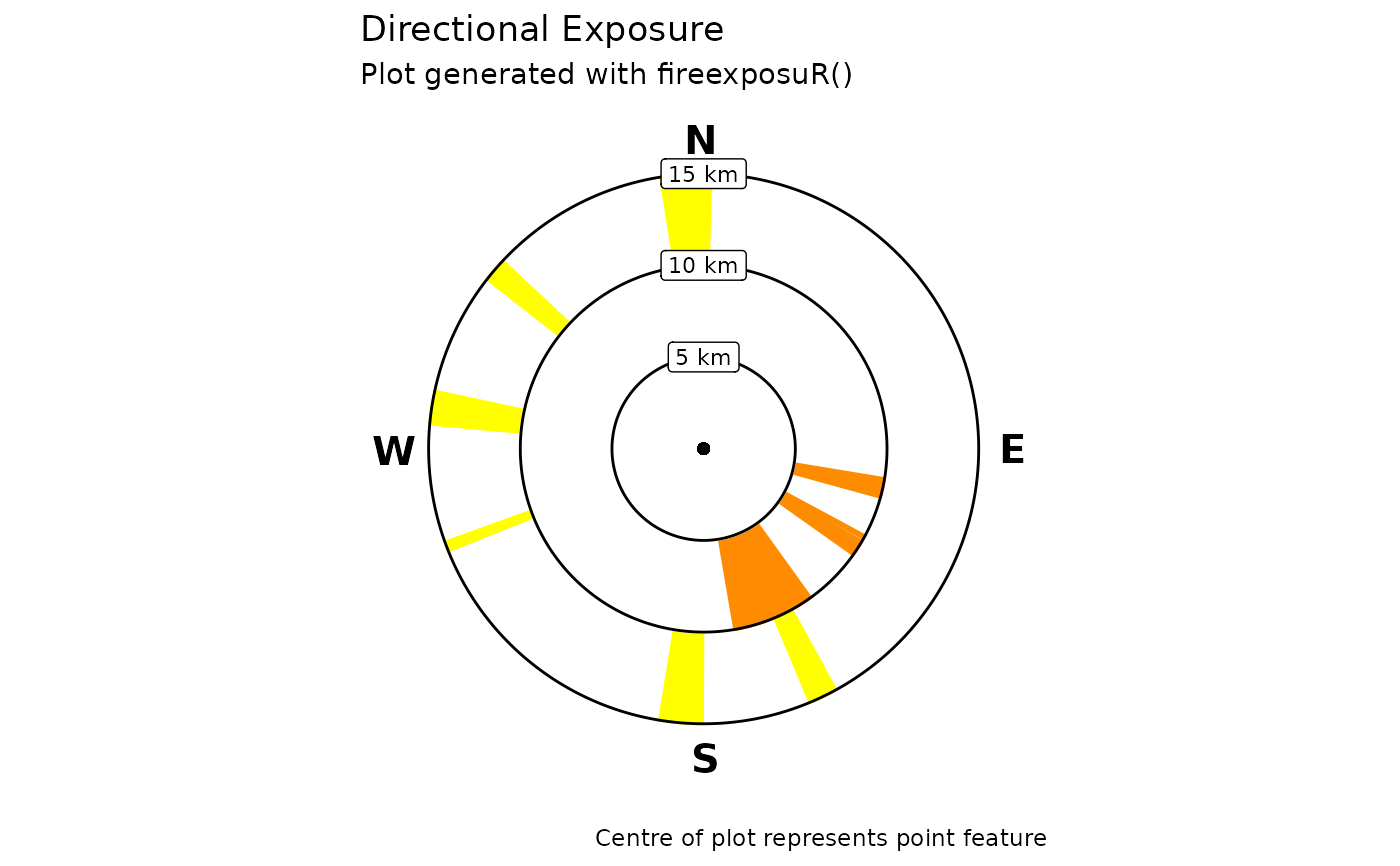
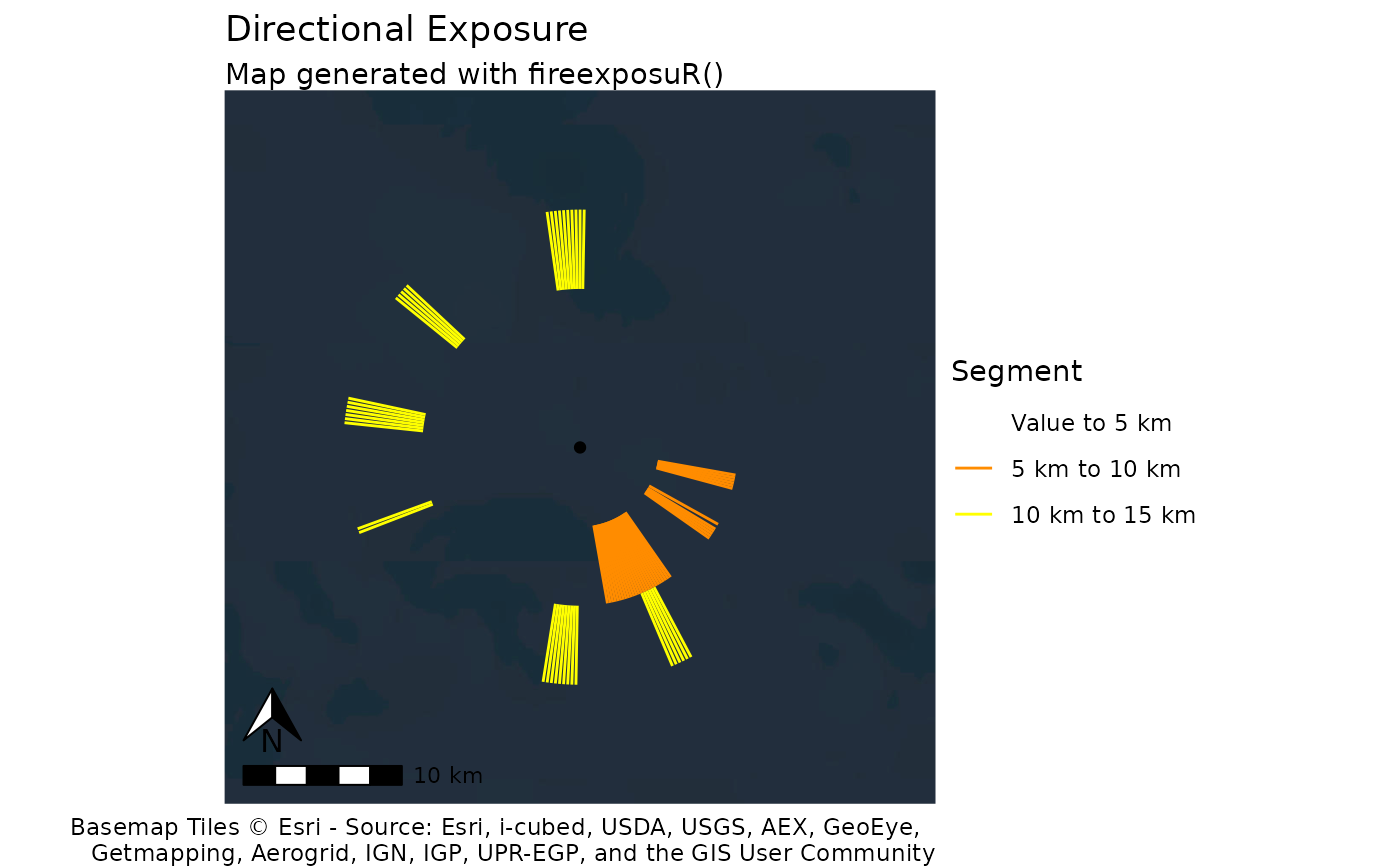
fire_exp_dir_plot() plots directional exposure following
methods from Beverly and Forbes 2023 as a standardized radial plot,
mapped with a basemap, or as a table.
Arguments
- transects
SpatVector (output from
fire_exp_dir())- value
the same Spatvector of value as a point or simplified polygon used for
fire_exp_dir()- map
Boolean, when
TRUE: returns a map of the viable transects. The default isFALSE
Value
a standardized plot as a ggplot object, or if map = TRUE a
standardized map as a ggplot object
Examples
# read example hazard data ----------------------------------
filepath <- "extdata/hazard.tif"
haz <- terra::rast(system.file(filepath, package = "fireexposuR"))
# generate an example point ---------------------------------
wkt <- "POINT (500000 5000000)"
pt <- terra::vect(wkt, crs = haz)
# -----------------------------------------------------------

exp <- fire_exp(haz)

# compute transects
transects <- fire_exp_dir(exp, pt)

# radial plot of directional exposure
fire_exp_dir_plot(transects, pt)


#' # mapped directional exposure transects
# note: example data is drawn in the ocean so basemap is not representative
fire_exp_dir_plot(transects, pt, map = TRUE)
#> <SpatRaster> resampled to 500554 cells.
